Automatic Artifact Rejection with
Dynamic Reliability
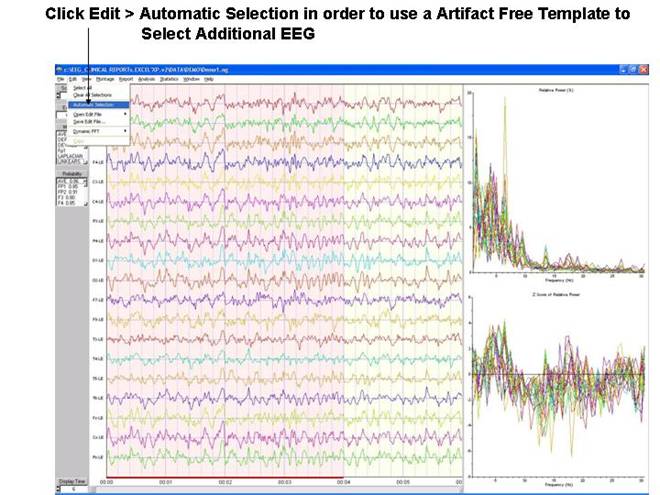
Step # 4 - Use the Automatic Artifact procedure to
select “Good” & “Reliable” artifact free and representative samples of EEG
as a template for quantitative analysis.
4a- For
automatic template selections Click Edit > Automatic Selection.
We will use the 1st 2 seconds of selected EEG as a template of “Good” EEG, this
is only for illustration and to note that the first 2 seconds is generally not
a good period to select from. Press the left mouse button and drag it across
the first 2 seconds of EEG. De-select
using the right mouse button. A “good”
EEG sample is
split-half reliability ≥ .95, test re-test reliability > 0.90 and Edit
Time ≥ 60
seconds.
4b- The
Default multiplier is 1.0. Click O.K. and the FFT and Z scores of
the edited selections will be displayed. Cut Off Multiplier = 1.0
is a RMS amplitude match for each 2 seconds of EEG that are equal to or less
than the RMS amplitude of the user selected EEG template. 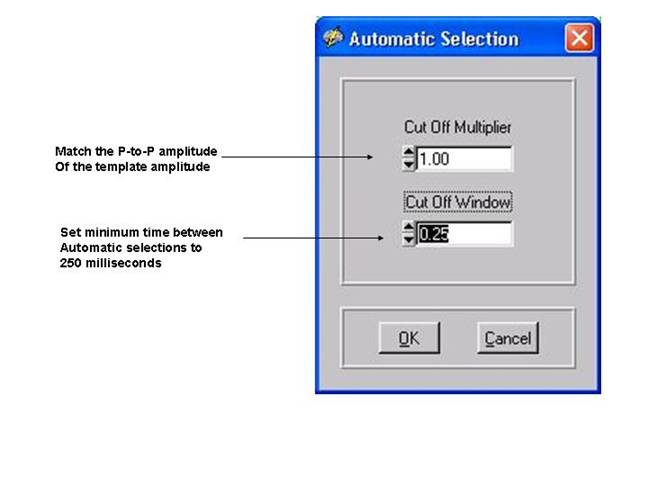
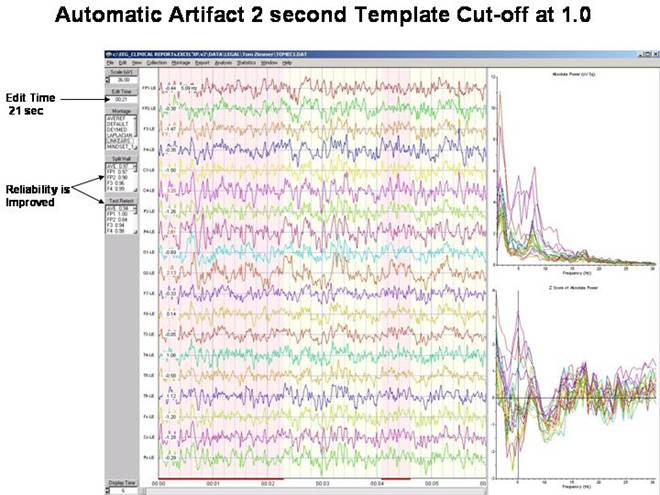
4c - Edit time is now 21 seconds and
Reliability is improved. Visually Re-scan the EEG to de-select
segments that may have artifact and to select Good and representative EEG
segments that may have been omitted.
4d- To change the template
selection of “Good” EEG, highlight “Clear Automatic Selections” and then repeat
the automatic selection process by clicking Edit > Automatic
Selections. To change the Cut-Off highlight “Clear Automatic Selections”
and repeat steps 4a and 4b.
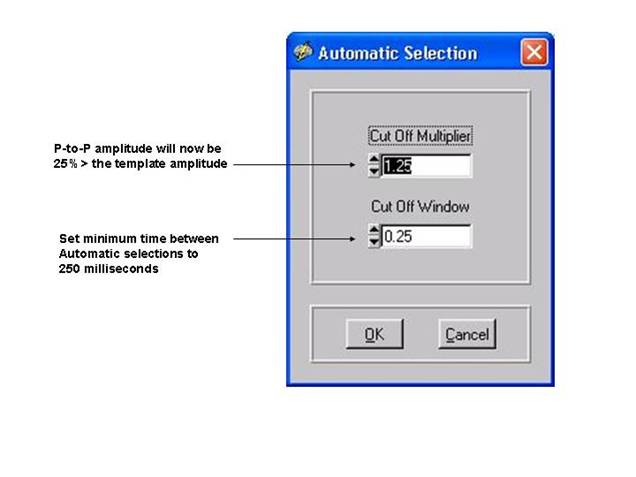
The Cut Off
Multiplier determines the amplitude of match to the “Good EEG” template.
When the cut off multiplier = 1.25 then the match will be 25% larger
peak-to-peak amplitude than the template amplitude, if it is 1.5 then the match
will be 50% larger amplitude than the template. The Cut Off Window is the delay between automatic
selections. A value of 0.25 = 250 millisecond minimum gap between
automatic selections and a value of 0.5 = 500 millisecond minimum gap between
automatic selections, etc.
4e- Click
O.K. using the 1.25 Multiplier Cut-Off and see a larger sample of EEG of
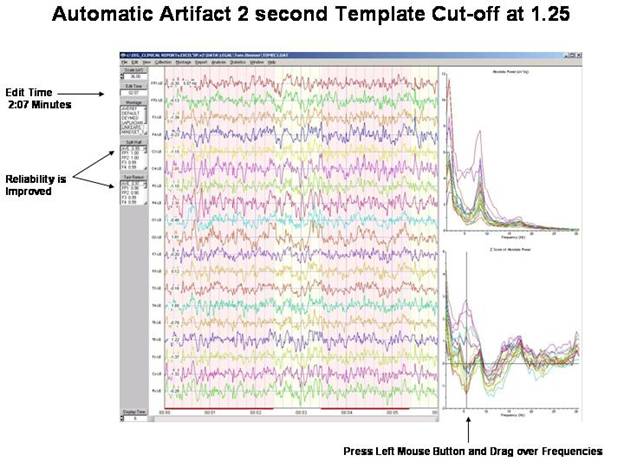
Press the left mouse button and scan the Z scores
while observing the Z score values at the left margin of the EEG tracings for
the different frequencies of the spectrum